A cool Pew infographic shows S&P credit ratings for the 50 states since 2001. See the infographic here.
We’ve taken those data, translated the AAA-on-down rating scale to a numerical score (12-on-down), and included the data in State Data Lab.
Below is a chart showing the 50-state-average credit rating since 2001, using the charting facility at State Data Lab.
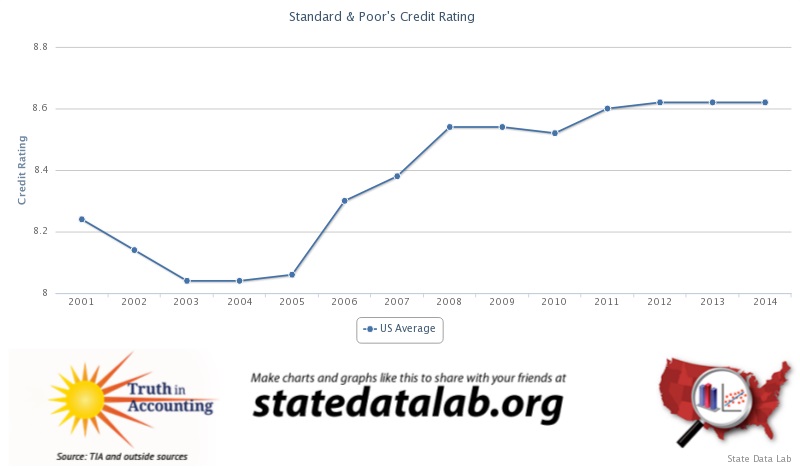
The 50-state-average S&P credit rating declined after the 2001 recession, then began to recover in 2005, starting a long-term uptrend only briefly interrupted by the Great Recession of 2007-2009.
Has credit quality been on the rise, on average, among the 50 state governments in the last decade?
A much longer story under this, to be sure, but it seems, well, counterintuitive in light of market and financial data.
The credit rating agencies are careful to note that their ratings measure relative, not absolute, credit quality.
But what do you think may be underneath this long-term uptrend?
One thing that is not in a long-term uptrend is S&P’s rating for Illinois. Here’s a link to a chart comparing Illinois to that 50 state average.
If grade inflation is at work in the rising 50-state-average credit rating, the decline in Illinois’s rating doesn’t necessarily mean grade inflation is not at work for Illinois. The credit quality of Illinois may still be even worse than implied in the chart link above.
p.s. we’ve done some work comparing Truth in Accounting’s “Taxpayer Burden” to state credit ratings, and the former tends to lead the latter, not the other way around.