The Connecticut Business & Industry Association (CBIA) recently surveyed state businesses about the economy. Commenting on the results, Pete Gioia (an economist with CBIA) stated:
“The economy is growing, however, the rate has been slow compared to our own long-term growth rate, and when compared to the U.S. average” Gioia said. “Combined with the state’s fiscal situation, it’s clear we’re at a critical turning point and lawmakers need to make decisions that will encourage growth, not hinder it.”
Gioia was quoted in an article by Reece Alvarez in the Fairfield County Business Journal. In the article, Alvarez wrote:
“Gioia points to hundreds of millions of dollars in shortfalls the state is facing as well as reports indicating that Connecticut is drowning in red ink — a point about which state Sen. Toni Boucher (R-26th Assembly District) has been vocal.”
In his article, Alvarez also quoted Boucher:
“… “To those who think that Connecticut is not drowning in red ink, think again,” Boucher said in a recent statement on the state economy. “Connecticut has only $10.1 billion of liquid assets available to pay debts totaling $72.2 billion. To fill this financial hole each taxpayer would need to send $48,600 to the state.” She references a $370 million deficit this year, a more than $550 million deficit next year, and a Truth in Accounting’s state data lab report ranking Connecticut 49 out of 50 in fiscal health.”
Then, Alvarez returned to Gioia;
““There has got to be a way that state policy makers solve this crisis without adding on burdens, such as additional taxes on business or individuals that will slow growth,” Gioia said.”
Let’s take a look at some support for these assertions.
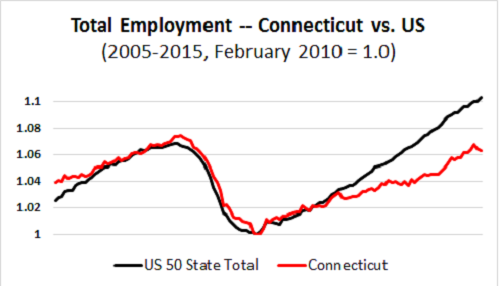
The chart below compares total employment across the 50 states with total employment in Connecticut, since 2005. After our recent Great Recession, total employment bottomed out in February 2010. Indexing the 50 state total and Connecticut to that point, you can clearly see Connecticut lagging in recent years.
Connecticut isn’t alone on this score. Along with Connecticut, the other top 5 “Sinkhole States” (states with the highest “Taxpayer Burdens,” as calculated by Truth in Accounting) include Illinois, Kentucky, Massachusetts, and New Jersey. The next chart shows total employment for these 5 states compared to the 50 state total, again indexing to February 2010 = 1.0. The picture looks quite the same as it does for Connecticut alone.
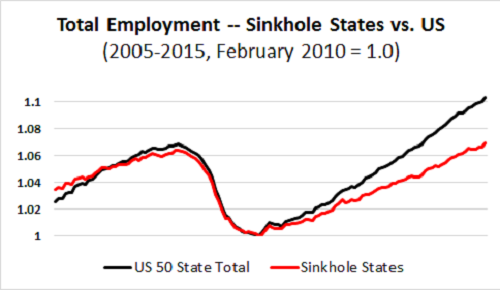
While employment has been recovering in the ‘sinkhole states,’ it is clearly recovering more slowly than it is around the rest of the nation.
The same holds true for housing markets. The chart below shows the Federal Housing Finance Agency (FHFA) Home Price index for Connecticut, compared to the 50 state total, both indexed to 2011, the bottom (for a year) in the housing implosion.
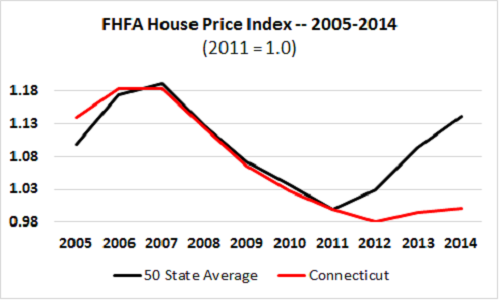
Connecticut had a downturn in line with the decline of the 50 state average from 2007 to 2011. But the bottom didn’t arrive for Connecticut until 2012, after the national bottom. And the recovery has clearly been meager in Connecticut.
So, too, looking at Connecticut’s fellow members in the “Sinkhole States” category. The next chart shows the FHFA House Price Index for the 50 states compared to the average for the 5 Sinkhole States, again, indexing to 2011 = 1.0:
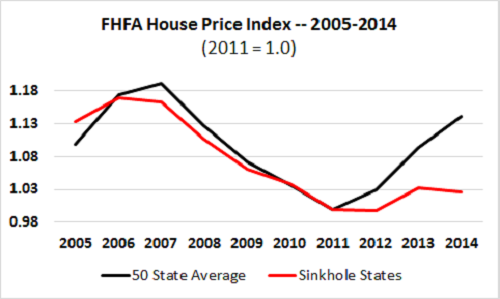
Ouch.
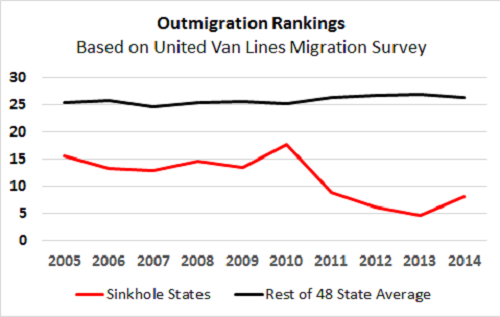
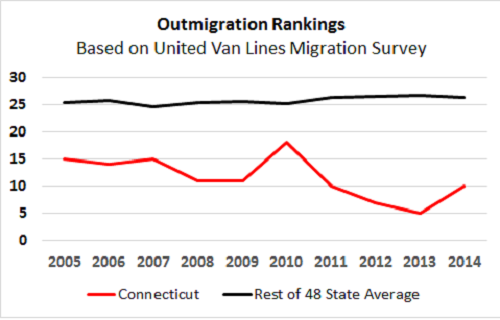
Looking across the 50 states, employment growth and housing market conditions are related to migration patterns. The next chart below is based on United Van Lines’ annual Migration Survey, another dataset Truth in Accounting maintains in our State Data Lab website. It shows the average ranking for the 5 Sinkhole States in the share of outbound shipments, together with the average ranking for the rest of the 48 continental United States. The lower the number on the ranking, the higher the outmigration, and outmigration is clearly running higher in the Sinkhole States – with the difference becoming more pronounced in recent years.
So it goes with Connecticut, as well.
Now, to a certain degree, causation runs in both directions here. States with sluggish economies see more pressure on their government finances, while states with poor government finances can effectively set higher hurdles for their economies. But as a measure of state fiscal health, Truth in Accounting’s “Taxpayer Burden” represents the cumulative current effect of longstanding fiscal practices. These practices matter for the recent deterioration in relative economic performance in the Sinkhole States.