Taxable income fuels government financial engines. Some states are rapidly running out of gas.
Last week, the Internal Revenue Service released new migration statistics based on individual income tax return filings. We have added the data to Truth in Accounting’s State Data Lab, including migration for the number of returns, the number of exemptions (people), and the amount of adjusted gross income (AGI).
In the last five years, the five states with the highest net outmigration of per-taxpayer AGI turn out to be (in order, highest first) Connecticut, Illinois, New York, New Jersey, and Maryland. Among those five states, 2016 marked the worst year of the last five.
What characteristics do these five states tend to have in common when compared to the other 48 continental United States? (We usually exclude Alaska and Hawaii in our migration research.)
The table below shows a set of demographic, economic, and financial factors we have ranked the states on (data that we also include in State Data Lab). They are ranked from top to bottom in how closely “correlated” they are to AGI migration in the last five years. The first column to the right of the factor is the correlation coefficient calculated for that factor and AGI migration (the higher the absolute value of that number, the tighter the relationship). The next column shows the average ranking for the five states with the highest AGI outmigration on those variables. (The farther away from 24, the more likely that these five states are significantly different from the other states on that factor.)
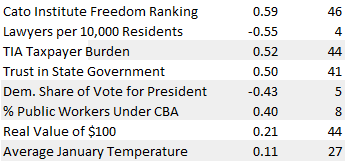
Cato Institute Freedom Ranking. This variable shows the strongest relationship with AGI migration. Cato measures the states based on various elements of “freedom” and produces an overall ranking. In the last five years, people and income have been migrating to “freer” places, and away from states that rank low on freedom. In turn, the five states ranking highest on AGI outmigration also rank very low on Cato’s freedom rankings.
Lawyers per 10,000 Residents. This ranking is based on data from the American Bar Association for the number of “active” and “resident” lawyers across the 50 states. In the last five years, AGI has been migrating away from lawyer-intensive states. And the five states with the highest per-taxpayer AGI outmigration (Connecticut, Illinois, New York, New Jersey, and Maryland) also rank high, on average, in lawyers per 10,000 residents.
TIA Taxpayer Burden. This ranking is based on Truth in Accounting’s “Taxpayer Burden” calculation of the per-taxpayer amount of assets needed (available) to pay bills, after including retirement benefit obligations and excluding capital assets (and debt related to capital assets). In the last five years, AGI has been moving toward states with low Taxpayer Burdens, and fleeing states with high Taxpayer Burdens. Those five states with the highest AGI outmigration rank very poorly on TIA’s Taxpayer Burden.
Trust in State Government. This ranking is based on a recent Gallup poll. AGI has been migrating away from states with low trust among their citizenry, and toward places where citizens trust their state government. The five states with the highest outmigration rank poorly on trust in state government.
Dem. Share of Vote for President. This ranking is based on electoral records from the last five presidential elections. AGI is migrating away from states that exhibit higher Democratic vote percentages, and the five states with the highest AGI outmigration rank high on Democratic vote percentages.
% Public Workers Under CBA. This ranking is based on the share of public sector employees covered by collective bargaining agreements (unionized government employees). In general, states with higher unionized concentrations tend to be characterized by higher TIA Taxpayer Burdens, and in turn, higher AGI outmigration in recent years.
Real Value of $100. This ranking is based on the Tax Foundation’s analysis of economic data produced by the U.S. Department of Commerce’s Bureau of Economic Analysis. AGI tends to be migrating away from states with lower buying power in recent years, and the five states with the highest AGI outmigration rank low on the Real Value of $100 report.
Average January Temperature. This ranking helps identify colder vs. warmer states. Surprisingly, the relationship with AGI Migration appears marginal compared to the variables above. Some regression analysis indicates, however, that after controlling for other factors explaining AGI Migration, there is a statistically significant effect operating – colder states do tend to have higher AGI outmigration than warmer states in the last five years.
Granted, income taxes aren't the only source of tax revenue for state and local governments. But if the birds are flying elsewhere, those other sources of tax money are at risk as well.