When crises arrive, lobbying activity intensifies. When lobbying activity intensifies, it can impact migration trends, especially for Washington, DC. Given the current pandemic/lockdown crisis and calls for more federal “relief,” we may learn some lessons about the fruits of lobbying labor from 2009, when we had one of the worst financial and economic crises in U.S. history.
There are a variety of sources for tracking migration trends within the United States. The Internal Revenue Service (IRS) provides some of the most detailed data available. Their migration statistics are based on tracking income tax returns filed by zip code. IRS datasets include total outmigration and inmigration by state, as well as individual state-to-state outmigration and inmigration for all 50 states (and Washington, DC). The latter dataset allows you to assess what state people are going to when they leave a given state, as well as what state people came from when they filed in a new state, annually.
Looking at the net migration flows for DC vis a vis the states provides some pretty interesting results. (Alaska, Hawaii, and DC neighbors Maryland, Virginia and Delaware are excluded from the observations below.)
From 2005 to 2008, DC took in about 2,000 to 3,000 more tax filers than it lost to all the other states. Then, in 2009, amidst the financial and economic wreckage and associated premium on lobbying activity, net migration to DC surged from 2,215 to 4,392 filers.
When comparing all the states on the net migration from those states to DC in 2009, there is an interesting and possibly disturbing pattern. States with higher net migration flows to DC in 2009 tend to be a) states with governments that were in relatively bad financial shape in 2009, and b) states with governments whose financial condition deteriorated more from 2009 to 2018. Those results hold both for total net migration to DC, as well as net migration as a share of the total state population.
What could be driving the bus on this result? One is tempted to conclude that states with more net migration to DC in 2009 have populations with tighter connections to governmental financial levers. The term “rent-seeking” has been developed in political economy to describe a process whereby the pursuers of profit do their best to succeed not only in the marketplaces where they serve their customers, but in the political arena, carving out favorable legislation, regulation, and bailouts. In turn, the public purse in states with higher “rent-seeker” concentrations may be more vulnerable to similar forces within those states.
Who are the states with the highest (and lowest) net migration to DC in 2009?
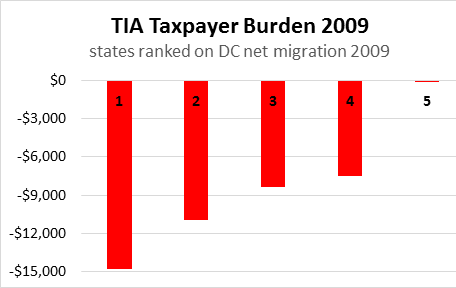
Dividing the 45 states (excluding Alaska, Hawaii, Maryland, Virginia and Delaware) into five buckets of nine states apiece, here’s a look at the average Truth in Accounting (TIA) Taxpayer Burden for 2009 for the five buckets of states ranked (highest to lowest) on total net migration to DC in 2009:
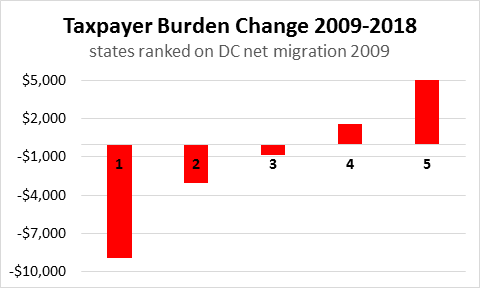
Here’s a look at the deterioration in TIA’s Taxpayer Burden from 2009 to 2018 for the state buckets when ranked on total net migration to DC.
A future report will take a closer look at the characteristics of the states in Bucket Number 1 and Bucket Number 5. For now, here’s a look at the average number of lawyers per 10,000 residents for each of those five categories of states.
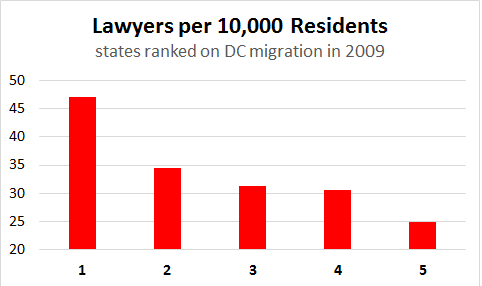
Lobbying involves lawyers. Maybe it’s a coincidence, and other factors are at work, but states with high net migration to DC in 2009 tend to be more lawyer-intensive states.
We will not have 2020 IRS migration data for a year or two, but that will be interesting to see when it comes out.