Truth in Accounting is a nonpartisan 501(c)(3) organization whose mission is to educate and empower citizens with understandable, reliable, and transparent government financial information. On top of providing financial reports on each state and the 75 largest cities in the U.S., Truth in Accounting has created a project called the State Data Lab that allows users to explore easily accessible data on the state and city of their choice.
Beginning on July 30, 2019, Truth in Accounting is expanding its State Data Lab website to offer federal data in addition to city and state data that is already made available to users. The State Data Lab allows users to select different data series, states, or cities and create charts comparing the chosen data. The website includes more than 600 data series with financial, demographic, and economic statistics.
Users will be able to create charts using data series specifically for the federal government. Truth in Accounting believes that this data is crucial to users because it provides more transparency into the national debt and deficit, and how the federal government is spending taxpayer dollars. The new federal data provided focuses mainly on the federal government’s financial and economic conditions, including data that the federal government does not put on its balance sheet, but which is provided by Truth in Accounting’s analysis of the numbers given. These data series provided by Truth in Accounting include unfunded Medicare and Social Security promises.
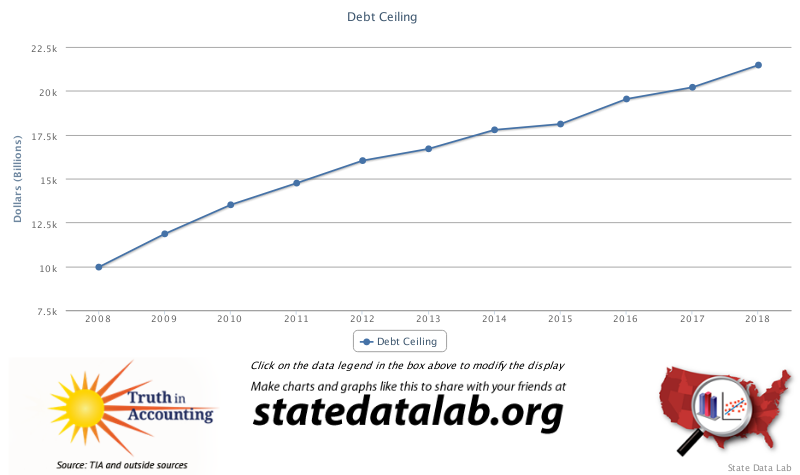
The chart below is an example of what you can create using the federal data provided by the State Data Lab. In the first example, you can choose one data series, a specific time frame, then create a chart. In the first chart, we can see how the debt ceiling has increased by 116 percent from the years 2008-2018.
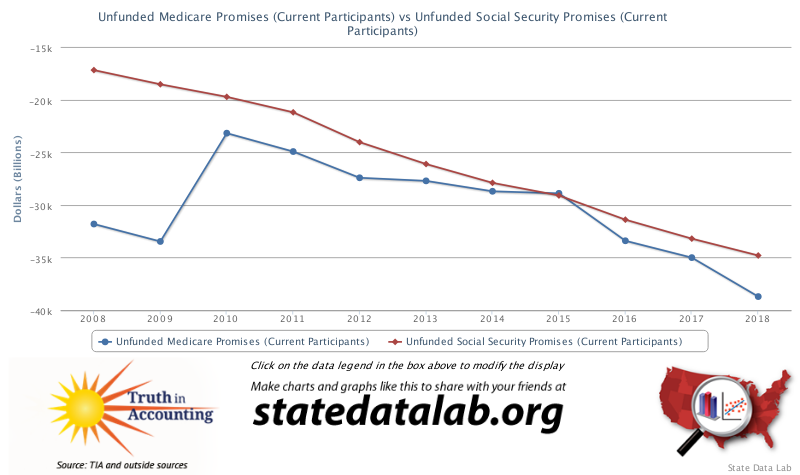
You will also have the option to choose more than one data series as shown in the chart below. This second chart, shows how much Social Security and Medicare promises are unfunded. Both of these programs are more than $31 trillion in the hole, which means that the federal government needs more than $60 trillion to pay off both of these unfunded obligations.
These two examples give you an idea of all the different charts you can create with more than 250 different, new federal data series offered on State Data Lab. This data is available for you to check out by going to statedatalab.org. Once you are on the site, go to the charts tab and click on “Create your own federal chart” to check out all that is offered and what you can learn about your federal government’s finances!