Last week, right before a three-day weekend, the United States Treasury Department released the annual Financial Report of the U.S. Government. This report covered the fiscal year ended September 30, 2016, and was introduced by outgoing Treasury Secretary Jacob Lew as a “strong report.”
But the federal government’s finances appear to have deteriorated significantly last year:
The federal government’s net operating cost basically doubled, ‘rising’ from a reported loss of $504 billion in 2015 to a loss of $1.047 trillion in 2016. Net operating cost is like a bottom-line measure of net income in the private sector, showing the difference between tax revenue and fee income compared to the cost of government operations.
The federal government’s estimate of its ‘fiscal gap’ rose by one-third from 2015 to 2016. This is a longer-term, forward-looking measure, as opposed to annual net operating cost. It is an estimate of the amount of spending cuts and/or tax increases the federal government would have to undertake in order to keep the federal debt to GDP ratio from rising in coming decades. The fiscal gap is expressed as a percent of GDP, and the dollar amounts of implied required spending cuts and/or tax increases now run (annually) in the hundreds of billions of dollars.
Truth in Accounting’s measure of the ‘true’ national debt has risen nearly $10 trillion, given the results in this report. In 2016, the federal government’s estimates for unfunded obligations rose significantly, the main reason for this increase. We now estimate the ‘true’ national debt at $99 trillion. (To calculate the ‘true’ national debt, we start with the federal governments reported assets, and then subtract balance sheet liabilities as well as unfunded off-balance-sheet obligations for Social Security and Medicare.)
In recent years, a widespread mantra and perception has arisen along the lines that the Obama Administration has cut the budget deficit in half. The Administration arrived amidst the worst economic and financial crisis since the Great Depression, however, which made for a pretty easy starting point for ‘progress.’
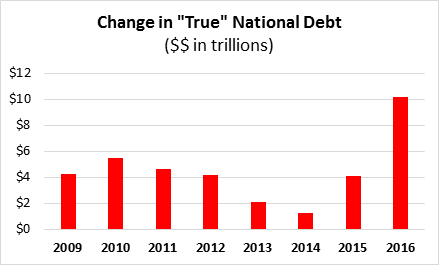
Another way to assess financial ‘progress’ is to look at the change, year to year, in the overall ‘true’ national debt. Here’s what the annual change in the ‘true’ national debt we calculate looks like, every year since 2008.
Back in 2008, the ‘true’ national debt stood at $59 trillion. It rose every year from 2008 to 2016, and at an accelerating pace the last two years. At nearly $100 trillion, it has risen by 66% since 2008.