We recently updated our Data-Z website with new economic and demographic information, including an annual report from the U.S. Census Bureau on building permits for 2020. This resource has been indicating that states with governments in relatively poor financial condition have had a slower long-term recovery from the 2008-2009 housing and financial crisis. While things perked up a little last year, it was generally more of the same in 2020.
For the 10 states in the nation with governments with the worst state government financial conditions, as measured by TIA’s Taxpayer Burden, building permits for new single-family homes rose about 10 percent, on average, in 2020 from 2019, a little slower than the 13 percent increase for the 10 states with governments in the best financial condition. But building permits for those 10 states in bad shape (New Jersey, Illinois, Connecticut, Hawaii, Massachusetts, Delaware, Kentucky, California, Vermont, and New York) were still less than half of what they were in 2005, on average.
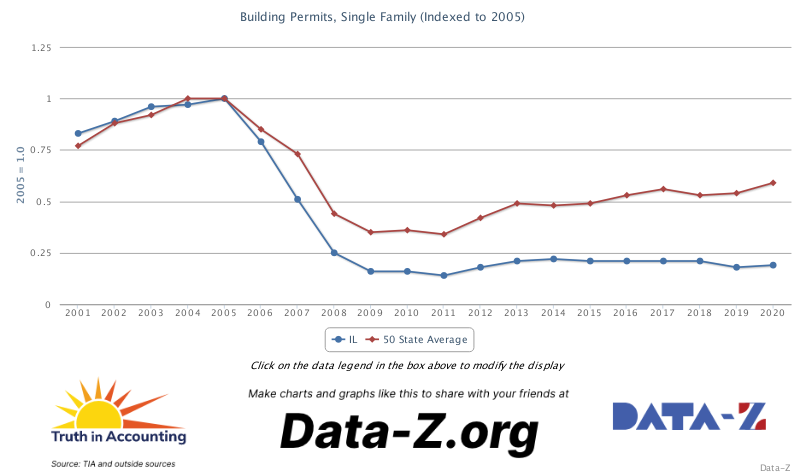
Granted, housing prices have been moving smartly higher. But people still aren't building a lot of houses in Illinois.
Here’s a look at Illinois, for example, compared to the 50 state average, using the chart facility we have on Data-Z.
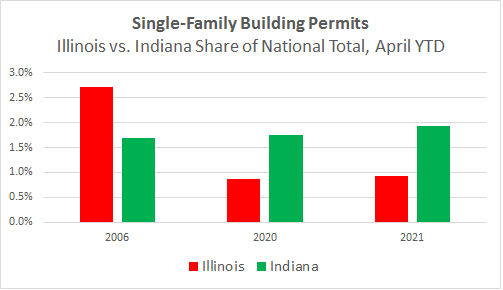
How is 2021 shaping up? Monthly building permits data can bounce around a fair amount, in light of weather and other factors. But here's what the year-to-date totals show (through April) for Illinois and Indiana, compared to the national results. Back in 2006, before the housing crash, Illinois accounted for 2.7 percent of the national Jan-April total, compared to 1.7 percent for Indiana. In 2020 and 2021, Illinois accounted for 0.9 percent of the national total, about one-third of where it was back in 2006. Indiana has been taking a significantly higher share of national permits than Illinois, in both 2020 and 2021.