Accounting standards effectively hid the accumulation of massive pension debts from state and local government balance sheets for decades. The pension debts owed to government employees are now being reported as debt. The next shoe to drop will be promises for retiree health care benefits.
You might be surprised how big those health care benefit debts are. Looking across the 50 states, and using the state governments’ own actuarial and accounting assumptions, total unfunded retiree health care obligations run about 80% as high as total unfunded pension obligations. Retiree health care debt actually runs higher than pension debt in 12 of the 50 states.
There’s an interesting if not dramatic characteristic of states that have accumulated relatively high retiree health care debt. It relates to differences between rankings of the 50 states on Truth in Accounting’s (TIA) overall measure of state government financial health (their “Taxpayer Burden”), on the one hand, and rankings of the states on the credit rating published by one of the large credit rating agencies, on the other hand.
Rankings of the states on credit ratings and Taxpayer Burden tend to run in the same direction. But there are good reasons credit ratings and TIA’s Taxpayer Burden can sometimes say very different things. Credit ratings are focused on bondholders, for example, while the Taxpayer Burden is a more holistic view of government financial strength. Credit rating agencies cite the ability of governments to tax as a source of financial strength, but TIA’s Taxpayer Burden measure reflects the fact that the power to tax isn’t necessarily a source of strength for the average taxpaying Joe and Jane. (See this article for a wider discussion of the differences between credit ratings and TIA’s Taxpayer Burden).
Some states have significantly higher rankings on credit ratings than they do on TIA’s Taxpayer Burden. When you rank the states from top to bottom on the difference between their rankings on these two measures, the states at the top of the list are those with stronger credit ratings than what might be expected given TIA’s Taxpayer Burden ranking. And the states at the bottom of the list are those with stronger relative positions for TIA’s Taxpayer Burden than might be expected given their credit rating.
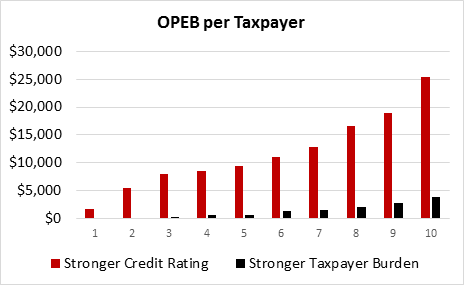
What characterizes the top ten (“Stronger Credit Rating”) states, compared to the bottom ten (“Stronger Taxpayer Burden”) states?
There is at least one dramatic difference between these two groups. The states with “Stronger Credit Ratings” have very high OPEB (retiree health care) debt per taxpayer, compared to the “Stronger Taxpayer Burden” states.
Those “Stronger Credit Rating” states also have higher pension debt per taxpayer, but the difference between the two groups isn’t nearly as dramatic as the difference for OPEB debt per taxpayer.
There are some interesting possible explanations here, among them questions whether OPEB debts have been adequately accounted for – in balance sheets, credit ratings, or bond market prices.
Note: State “#10” over there on the right of the chart is Delaware. See “How can Delaware be a AAA and an F at the same time?”