You can view a PDF of the report HERE.
On September 19, Truth in Accounting released its eighth annual Financial State of the States, a nationwide analysis of the most recent state government financial information. This comprehensive analysis of the 50 states’ finances includes background on new accounting standards coming into play, the most up-to-date state finance and pension data, trends across the states, and key findings.
This year, the study found that 41 states do not have enough money to pay all of their bills and in total the states have racked up over 1.5 trillion dollars in unfunded state debt. The study ranks the states according to their Taxpayer Burden or Surplus™, which is each taxpayer's share of state bills after available assets have been tapped. Check out the data for your state at the State Data Lab.
Report Findings
Does your state balance its budget?
Timeliness of state financial reports
New pension standard brings greater transparency
Retiree health care debt reporting rule will take effect in two years
Why is truthful, transparent, and timely information important?
Bring Full Accrual Calculations and Techniques (FACT) to budgeting

Government reports are lengthy, cumbersome, and sometimes misleading documents. At Truth in Accounting (TIA), we believe that citizens deserve easy-to-understand, truthful, and transparent financial information from their governments. Without this, how can they effectively participate in democracy?
Every September, we launch The Financial State of the States (FSOS) report. This is our eighth comprehensive analysis of the 50 state governments’ finances, and includes background on new accounting standards coming into play, trends across the states, and key findings.
This year, we found that 41 states do not have enough money to pay all of their bills. This means that in order to balance the budget, they have hidden debt off their balance sheets. TIA divides the amount of money needed to pay future bills by the number of state taxpayers to come up with the taxpayer burden. If there is a surplus, that number is likewise divided by the number of taxpayers to come up with a taxpayer surplus. We then rank the states based on these figures.
In our eighth iteration of the Financial State of the States (FSOS), we have implemented a grading system for the states to give greater context to each state’s taxpayer burden or surplus. Based on our grading methodology, three states received A’s, six received B’s, 13 received C’s, 19 received D’s, and nine states received an F.
States in general do not have enough money to pay their bills. Based on our analysis, the total state debt nationwide amounts to $1.5 trillion in unfunded debt. Most of this debt comes from unfunded retiree benefit promises, such as pension and retiree health care debt. This year, pension debt accounts for $832.6 billion, and retiree health care debt amounted to $614.9 billion.

Because government financial statements do not report all liabilities, elected officials and citizens are making financial decisions without knowing the true financial condition of their government. The lack of accuracy and transparency in government accounting prevents even an experienced user of government financial documents from understanding and evaluating a public sector entity’s financial health.
TIA believes it is imperative to provide an honest accounting of each state's financial condition. Therefore, we developed a sophisticated model to analyze all the assets and liabilities of all 50 states, including unreported liabilities. Since 2009, TIA has released its FSOS study annually, documenting the truth about each state’s financial position.
Since all levels of government derive their just powers from the consent of the governed, government officials are responsible for reporting their actions and the results in ways that are truthful and comprehensible to the electorate. Providing accurate and timely information to citizens, the media, and governmental officials is an essential part of government responsibility and accountability. The lack of transparency in financial information, state budgets, and financial reports makes it difficult for governments to meet this democratic responsibility.
This is the motivation and foundation for the non-partisan mission of TIA: to educate and empower citizens with understandable, reliable, and transparent government financial information. TIA is a nonprofit, politically unaffiliated organization composed of business, community, and academic leaders interested in improving government financial reporting. TIA makes no policy recommendations beyond improvements to budgeting and accounting practices that will enhance the public’s understanding of government finances.


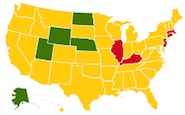
TIA ranks each state by its taxpayer burden or surplus. The taxpayer burden is the amount each taxpayer would have to pay to make the state debt-free. The taxpayer surplus is the amount left over after all bills are paid, divided by number of taxpayers in the state. We split states into two groups: states without enough money to pay their bills are Sinkhole States, and those with enough money are Sunshine States.
This year, there were 41 sinkhole states and nine sunshine states. The full 50 state ranking can be found on the next page. A full report for each state can be found at www.statedatalab.org by clicking on your state on the interactive map.
![]()
![]()

In our eighth FSOS, we have implemented a grading system for the states to give greater meaning to each state’s taxpayer burden or surplus. Based on our grading, here is the number of states for each grade:
A grade: Taxpayer surplus greater than $10,000
3 states (Alaska, North Dakota, and Wyoming)
B grade: Taxpayer surplus between $100 and $10,000
6 states (Utah, Nebraska, South Dakota, Tennessee, Idaho, Iowa, and New Mexico)
C grade: Taxpayer burden between $0 and $4,900
13 states (Oregon, New Mexico, Florida, Virginia, Arkansas, Indiana, Montana, Arizona, Georgia, Nevada, Colorado, Missouri, and Wisconsin)
D grade: Taxpayer burden between $5,000 and $20,000
19 states (Oklahoma, Ohio, New Hampshire, Kansas, Texas, Minnesota, North Carolina, Maine, South Carolina, Washington, Mississippi, Rhode Island, Alabama, West Virginia, Pennsylvania, Maryland, Michigan, Vermont, and Louisiana)
F grade: Taxpayer burden greater than $20,000
9 states (New York, California, Delaware, Hawaii, Massachusetts, Kentucky, Connecticut, Illinois, and New Jersey)

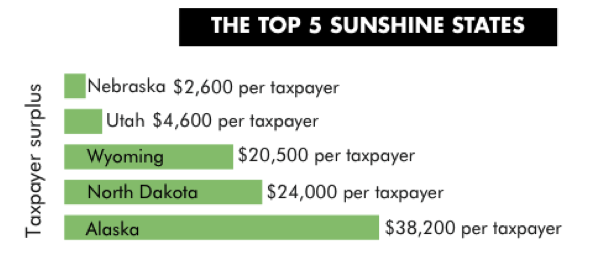
Each year, we rank the 50 states from best to worst based on each taxpayer's share of state debt. We call the best states the Sunshine States. These are states that have kept their finances in order, and have enough money to pay all their bills and then some. For example, Alaska ranks number one because it has the highest taxpayer surplus, which means it has the most money available to pay future bills after settling all of its debt. This year's top 5 Sunshine States are the following:
This year, all of our top five Sunshine States got worse financially. This is a stark difference from last year, when all the Sunshine States improved to some degree. Below you can see what changed specifically within each of the Sunshine States to worsen their financial conditions.
Alaska’s taxpayer surplus decreased because the state’s “Assets Available” decreased by $3.26 billion. This is primarily due to a $2.1 billion decrease in investment income since 2015.
North Dakota's Public Employee Retirement System changed actuarial assumptions (an estimate of economic and demographic variables that are used to calculate the pension liability and contributions) and as a result, their total pension liability increased by $184.3 million. The actuarial assumptions are used to project benefits, and changes in these assumptions can greatly impact the calculation of the total pension liability.
Wyoming’s unfunded retiree health care liability increased by $413.6 million, while the state’s assets available to pay bills decreased as the use of more assets became restricted. Furthermore, their investment earnings decreased by $628 million since 2015.
Utah's unfunded pension liability increased by $304 million, primarily due to a decrease in net investment income for its largest pension plan, which went from $1.2 billion to $297 million. The number of taxpayers also increased by 5 percent.
Nebraska's unfunded pension liability increased by $235.6 million, primarily because of differences between economic and demographic assumptions used to project benefits and what actually happened.

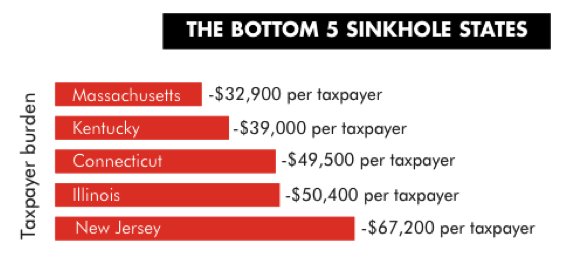
The worst ranked states, or states with the highest individual taxpayer burden, are called the Bottom 5 Sinkhole States. A Sinkhole State is a state with a taxpayer burden greater than $4,900, meaning the state does not have enough money to pay all of its bills. This year, the bottom 5 Sinkhole States are the following:
The states in our sinkhole group are the same as last year; however, Illinois beat Connecticut for the infamous ranking of the second worst state, moving down from third to second worst. Below you can see what changed specifically within each of the Sinkhole States to worsen their financial conditions.
In Massachusetts, total bills have increased by $7.9 billion while available assets have decreased by $105.5 million. The increase in bills is primarily due to the steady rise in pension liabilities and bonds payable.
In Kentucky, total bills have increased by $7.7 billion while available assets have decreased by $362 million. The increase in bills is primarily due to the rise in pension liabilities. The plan with the greatest increase was the Teachers’ Retirement System, which saw their unfunded pension liability increase by $6.5 billion (26.6%), primarily due to changes in assumptions and a decline in investment income.
The Illinois taxpayer burden increased primarily because of rising pension debt. The unfunded pension liability of the State Employees Retirement System grew by $6.1 billion, mainly because of actuarial assumption changes ($5 billion). Similarly, the Teachers’ Retirement System saw their unfunded pension liabilities increase by $8.4 billion, driven by changes in actuarial assumptions that increased the total pension liability by $7.6 billion and a decline in investment income of $1.8 billion.
In New Jersey, the increase in taxpayer burden is primarily due to a rise in pension liabilities of ($23.5 billion) and bonds payable ($16.7 billion). The Teachers’ Pension and Annuity Fund was hit hardest ($15.5 billion increase in unfunded liability) by changes of assumptions. The Public Employees’ Retirement System was also greatly affected by changes in assumptions. Their unfunded pension liability increased by $12.8 billion.

If a state has a balanced budget requirement, it makes sense that this would mean spending is equal to money brought in during a specific year. Unfortunately, in the world of government accounting, not everything is as it appears.
Of the 50 states, all but Vermont have balanced budget requirements. Yet, even with these rules in place, states have accumulated almost $1.5 trillion of unfunded debt.
How can states rack up debt and balance their budgets at the same time? It all depends on how you count.
States balance budgets using accounting tricks, such as the following:
- Inflating revenue assumptions
- Counting borrowed money as income
- Understating the true costs of government
- Delaying the payment of current bills until the start of the next fiscal year, so they aren’t included in the calculation
Although these retirement benefits will not be paid until the employees retire, they still represent current compensation costs because they were earned and incurred throughout the employees’ tenure. Furthermore, that money needs to be put into the pension fund in order to accumulate investment earnings. If states didn’t offer pensions and other benefits, they would have to compensate their employees with higher salaries from which they would fund their own retirement.
States should be responsible in both funding and reporting by including these promised benefits in the budget and funding them in the years employees earn them. Unfortunately, some elected officials have instead chosen to use some of the money that is owed to pension funds to keep taxes low, and pay for politically popular programs. This is like charging earned benefits to a credit card without having the money to pay off the debt. Instead of funding promised benefits now, they have been charged to future taxpayers. Shifting the payment of employee benefits onto future taxpayers allows the budget to appear balanced, while state debt is increasing.

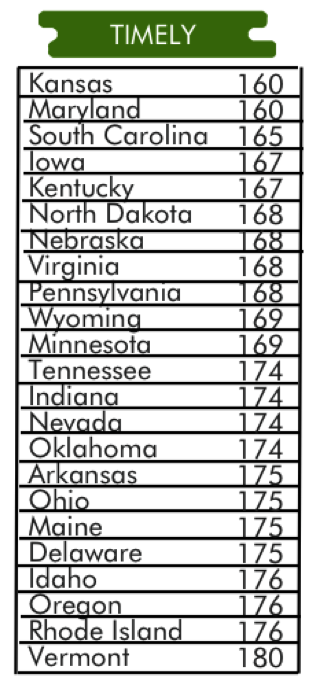
Timely information is crucial during government decision processes, such as creating a budget. However, most states issue their Comprehensive Annual Financial Reports (CAFRs) late. The standard for states to publish their CAFRs is 180 days after the end of the fiscal year. However, the national average for publishing these reports is roughly 200 days.
In 2015, the first year most states implemented a complex new pension accounting standard, 28 states took more than 180 days to produce their reports. There was some improvement on this score in 2016, but not a lot—22 states took more than 180 days to publish. This tardiness is not due entirely to the new pension standard: in 2014 before the standard, 21 states published after 180 days.
In 2016, nine states published their financial reports over 250 days after the fiscal year end. As of June 30th, 2017, Alabama and New Mexico still hadn’t released their financial reports, so the two are vying for last place for financial report timeliness. Due to their delayed reporting, their FY16 numbers are not included in our FSOS report. Last year, Alabama was the tardiest state. Its 2015 CAFR was due in March 2016, but was not published until April 17, 20177--385 days late after the 180-day deadline.
Most corporate financial reports are issued within 45 days of their respective fiscal year ends. There are internal difficulties and obstacles for states to reach this standard; however, timely financial information is critical so citizens and legislators can be knowledgeable participants in crucial decision making processes, such as voting and budgeting.
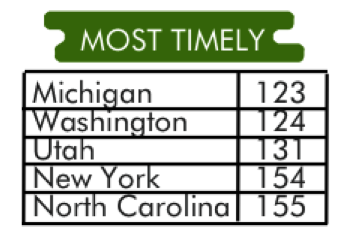
States that published their financial reports within the 180-day deadline are considered timely. The figure is the number of days the state published its financial report after its fiscal year end. Here are the states that reported their financials on time.
Here are the states that did not publish their financial reports within the 180-day deadline. Alabama and New Mexico had still not published their 2016 CAFRs as of June 30, 2017.
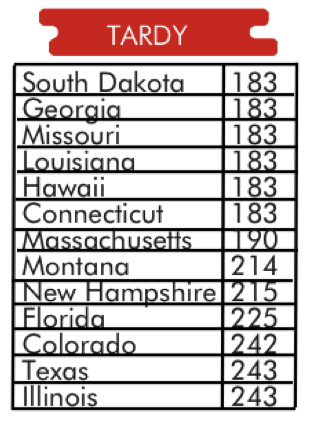

*CAFR unissued as of June 30, 2017”

In 1997, the Governmental Accounting Standards Board (GASB) enacted a rule, which required states to report only a portion of their pension debt, rather than their full pension debt. GASB 68, which took effect in Fiscal Year (FY) 15, and superseded the previous 1997 pension rule. With this standard implemented last year, states must now report their pension debt on their balance sheet.
State governments implemented GASB 68 when they published their FY15 CAFRs. As a result, governments’ reported pension debt changed dramatically. Total state reported pension debt increased from $80 billion in FY14 to $543 billion in FY15. This dramatic increase in reported pension debt correspondingly decreased most states’ reported net positions, or financial bottom lines. Total reported pension debt continued to rise to $637 billion in FY16.
Although this rule first began affecting states in FY15, the standard continues to increase states’ reported pension liabilities. This year many states had to restate their actuarial assumptions, including their discount rate, which increased their overall pension liability. This means that states’ overall net positions decreased.
Further complicating these pension numbers is the fact that some states continue to play games with their pension numbers by using 2015 numbers even though 2016 data is available. Using old data can often make states pension liabilities appear smaller than they currently are.

Similar to previously hidden pension debt, in two years (FY18) a new rule will be implemented, forcing states to report their retiree health care debt on their balance sheets. Our study found 69 percent of all promised health care benefits (totaling $423.5 billion) was not reported on states’ balance sheets in FY16.
Below is a chart looking at the changes in reported vs. total unfunded retiree health care debt in the 5 Bottom Sinkhole States. As you can see, there is a vast difference between what states currently owe and are actually reporting. With the impending change in the GASB reporting standard, states’ reported retiree health care liabilities will balloon, and their reported net positions will dramatically decrease.
The chart below shows just how large the gap is between unfunded retiree health care debt reported by states for FY16, and what is actually owed:
|
Bottom 5 states |
Reported |
Total |
Difference |
|
46. Massachusetts |
$7.46 billion |
$18.60 billion |
$11.14 billion |
|
47. Kentucky |
$3.48 billion |
$4.86 billion |
$1.38 billion |
|
48. Connecticut |
$9.99 billion |
$21.89 billion |
$11.9 billion |
|
49. Illinois |
$14.20 billion |
$44.46 billion |
$30.26 billion |
|
50. New Jersey |
$33.31 billion |
$70.04 billion |
$36.73 billion |

Democracy depends on an informed electorate. But due to current structures for both accounting and budgeting, the true financial health of a state can be obscured and citizens are deceived, or at best misled. Without access to truthful, timely, and transparent information, how can citizens be knowledgeable participants in their governments?
Accurate accounting requires all expenses to be reported in the state’s budget and financial statements when incurred, not when they are paid. Truthful budgetary accounting must incorporate all current compensation costs, including the portion of retiree benefits employees earn every year.
A lack of transparency in government finance leads to the following problems:
- Accounting tricks allow elected officials to claim balanced budgets, giving citizens a false sense of security, while states sink further into debt.
- Citizens do not know the true cost of their state government, and elected officials are able to spend amounts larger than the state’s revenues.
- Complex pension schemes, which both citizens and elected officials have difficulty understanding, rack up massive debts, putting the states even further in the red.
- Voters re-elect leaders based on false claims that budgets were balanced.
- Legislators create and continue new programs and increased services without knowing the true cost of government spending.
- Our representative form of government is undermined because citizens become cynical and do not trust their governments.
States should use financial reports from the previous year to calculate a more accurate and realistic budget for the following year. However, because financial reports are not timely, they cannot be used to assist the budgeting process. Furthermore, these budgets do not include all costs—they exclude large portions of compensation costs, because money is not set aside to cover retirement benefits as they are earned. Thanks to GASB 68, most of the pension debt is now being reported on the face of the balance sheet. However, some states continue to play number games with pension debt, using the previous year’s numbers even though current data is available. States also continue not to report the full cost of retiree health care debt in their budgets and balance sheets.
States’ efforts to climb out of their current financial holes must begin with honest government accounting. Only then can we debate and develop responsible alternatives to place the states on stable financial footing. As the saying goes, “if you can’t measure it, you can’t manage it.” How can states begin to find solutions to crushing debt if they don’t know how much debt there is?

Full Accrual Calculations and Techniques (FACT)-based budgeting requires governments to include expenses in their budgets when they are incurred, regardless of when they are paid. If a government promises pension benefits in the current period and must pay retirement claims in future periods, the liability and expense are recorded in the budget when the benefit is promised and earned. When the cash is actually paid, the liability is removed. This straightforward standard is a widely accepted private sector norm.
FACT-based budgeting allows governments to have complete knowledge of the financial health of the government. FACT-based budgeting also ensures that future taxpayers understand when they are left with the bill for services that they never received and will never receive.
FACT-based budgeting’s benefits include the following:
- Citizens would know the long-term effects of politicians’ current decisions.
- Politicians would have more difficulty hiding costs.
- Finances would be more transparent.
Through FACT-based budgeting, elected officials and citizens would have access to the true financial condition of their governments and be better equipped to make political and economic decisions both at the governmental level and in the voting booth.

Recommendations to citizens:
- To better understand your state’s finances, visit www.StateDataLab.org and select your state to see your government’s true financial condition.
- Encourage your politicians to balance the budget truthfully.
- Promote accountability of your elected officials by demanding the use of FACT-based budgeting.
Recommendations to elected officials:
- Use FACT-based budgeting.
- Determine the true debt of the state, including all post-employment benefit programs.
- Stop claiming to balance the budget while putting off expenses into the future, placing a larger debt onto incoming generations.
- To gain a more accurate picture of your government’s financial condition, download your state’s FSOS on www.statedatalab.org.
- Encourage state financial information to be provided to taxpayers in a more timely fashion.
Recommendations to government financial report preparers:
- Implement new retirees’ health care reporting standard early by putting full unfunded retirees’ health care liabilities on next year’s balance sheet.
- Release financial reports on time.Use the most recent pension data, not the previous year’s even if this requires a delay in issuing the government CAFR.
- Require governments to use the most recent pension data.
- Require governments to implement the new retirees’ health care reporting standard in the preparation of next year’s balance sheet.
Recommendations to standard setters:
- Require governments to use the most recent pension data.
- Require governments to implement the new retirees’ health care reporting standard in the preparation of next year’s balance sheet.

TIA researchers use a thorough and holistic approach to determine the status of government finances. This approach compares bills—including those related to retirement systems, and excluding debt related to capital assets (such as land, buildings, and infrastructure)—to government assets available to pay these bills. We exclude capital assets because these should not be sold off to pay bills.
TIA ranks each state by taxpayer burden or surplus. The taxpayer burden is the amount each taxpayer would have to pay the state’s treasury in order for the state to be debt-free.
Some states may have a taxpayer surplus, which is each taxpayer’s share of the state’s surplus.
![]()
- Alaska, pg. 30
- North Dakota pg. 32
- Wyoming, pg. 34
- Utah, pg. 36
- Nebraska, pg. 38
- South Dakota, pg. 40
- Tennessee, pg. 42
- Idaho, pg. 44
- Iowa, pg. 46
- Oregon, pg. 48
- New Mexico, pg. 50
- Florida, pg. 52
- Virginia, pg. 54
- Arkansas, pg. 56
- Indiana, pg. 58
- Montana, pg. 60
- Arizona, pg. 62
- Georgia, pg. 64
- Nevada, pg. 66
- Colorado, pg. 68
- Missouri, pg. 70
- Wisconsin, pg. 72
- Oklahoma, pg. 74
- Ohio, pg. 76
- New Hampshire, pg. 78
- Kansas, pg. 80
- Texas, pg. 82
- Minnesota, pg. 84
- North Carolina, pg. 86
- Maine, pg. 88
- South Carolina, pg. 90
- Washington, pg. 92
- Mississippi, pg. 94
- Rhode Island, pg. 96
- Alabama, pg. 98
- West Virginia, pg. 100
- Pennsylvania, pg. 102
- Maryland, pg. 104
- Michigan, pg. 106
- Vermont, pg. 108
- Louisiana, pg. 110
- New York, pg. 112
- California, pg. 114
- Delaware, pg. 116
- Hawaii, pg. 118
- Massachusetts, pg. 120
- Kentucky, pg. 122
- Connecticut, pg. 124
- Illinois, pg. 126
- New Jersey, pg. 128