Yesterday, United Van Lines (UVL) released its annual “National Movers Study.” UVL is one of the largest moving companies in the US, and has done this survey since 1978. The study calculates the share of outbound moves out of total UVL interstate moves for each of the continental 48 states.
In the latest results, New Jersey, Illinois, New York, Connecticut and California were the five states with the highest outmigration. All five of these states rank in the bottom ten states based on Truth in Accounting's "Taxpayer Burden" measure of state government financial condition.
More generally, how do high outbound states differ from high inbound states? What factors are associated with the migration patterns identified by UVL? These questions can be explored with the data and charting tools at Truth in Accounting’s “Data-Z” website facility.
The chart below ranks 10 financial, economic and demographic factors in terms of their association with UVL’s latest rankings on outbound migration. The factors are ranked from lowest to highest in terms of the significance/strength of their relationship with UVL’s migration rankings. The black line shows the absolute value of the difference between state rankings on that factor for the 10 highest and lowest outbound migration states. The red line shows the correlation coefficient for the factor rankings and the rankings for outbound move percentage, for all 48 states.
Moving from left to right, the stronger the relationship. The ten factors and the direction of the relationship are described below the chart.
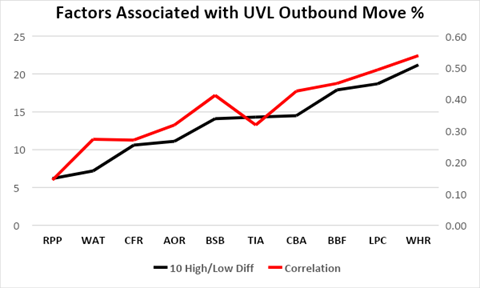
RPP => Regional Price Parity. People tend to be moving out of states with higher living costs as measured by this U.S. Census Bureau statistic. This is the least significant of the 10 explanatory factors.
WAT => Winter Average Temperature. People tend to be moving out of colder winter states. This is the second-least significant of the 10 factors.
CFR => Cato Freedom Index. People tend to be moving out of “less-free” states, as measured by the Cato Institute’s latest “Freedom in the 50 States” ranking.
AOR => ALEC Economic Outlook Ranking. People tend to be moving out of states ranking lower on the American Legislative Exchange Council’s latest Economic Outlook Ranking.
BSB => Best States for Business Ranking. People tend to be moving out of states ranking lower on Chief Executive Magazine’s latest Best States for Business survey ranking.
TIA => Taxpayer Burden Ranking. People tend to be moving out of states ranking worse on Truth in Accounting’s latest “Taxpayer Burden” ranking of state government financial positions.
CBA => Collective Bargaining Agreements. People tend to be moving out of states ranking higher on the share of public sector employees covered by collective bargaining agreements.
BBF => Balanced Budget Frequency. People tend to be moving out of states that rank lower on how often their state government kept accrual expenses below accrual revenue, annually, since 2005. There is a strong relationship between Balanced Budget Frequency and Truth in Accounting's "Taxpayer Burden" -- states that have regularly kept accrual expenses in line with or below accrual revenue tend to be in better financial condition today.
LPC => Lawyers Per Capita. People tend to be moving out of states that rank higher on lawyers per capita. This is the second-strongest relationship of the 10 “explanatory factors.” There could well be a longer "public choice school of economics" story here. But curiously, there is a strong negative relationship between Lawyers Per Capita and Balanced Budget Frequency. Lawyer-intensive states tend to have governments in worse financial condition, and have significantly lower balanced budget frequencies -- legal "balanced budget" requirements notwithstanding.
WHR => WalletHub Ranking. People tend to be moving out of states that rank higher on WalletHub’s latest ranking of current taxpayer burdens (taxes paid as a share of income). This is the strongest relationship of the 10 factors.
This is a simple listing of bilateral relationships. It's not a sophisticated econometric model. But it points in directions of concern, and areas for improvement.