Dave Lemery at Watchdog.org recently wrote an article titled, “New Index Seeks to Quantify ‘New Hampshire Advantage’ Over Neighboring States.” The article tells the story of a new index developed by the Granite Institute, a right-leaning public policy think tank . The index is used to compare New Hampshire to its neighbors on economic growth and factors that may promote (or impede) growth. The index appeared to confirm anecdotal references to the ‘New Hampshire Advantage,’ at least relative to neighboring states.
After reading the first two paragraphs, I stopped reading and tried to develop my own index, and to see how it performs compared to the index developed by the Granite Institute. It’s pretty easy to do, at least in quick and dirty fashion, with the tools available on our State Data Lab website.
Since 2003, New Hampshire’s GDP growth has been in the middle of the pack when compared to its neighbors. However, looking at New Hampshire and how it ranks on factors I selected as indicators that can matter for economic growth, New Hampshire indeed ranks highest among its neighbors.
The factors I selected (all of which can be found on State Data Lab) are Forbes’ Best States for Business rankings, the Cato Economic Freedom rankings, rankings on trust in state government according to the most recent Gallup poll, rankings for lawyers per capita (a proxy for regulation), and Truth in Accounting’s Taxpayer Burden rankings.
Collectively, these five indicators do a good job of explaining economic growth differences across the 50 states.
Looking at New Hampshire and its neighbors, here is the average rank for these five factors (the lower the number, the higher the ranking).

New Hampshire ranked the highest compared to its neighbors.
After putting this together, I went back and read the rest of the article. The Granite Institute’s index, which was developed by J. Scott Moody, also relies on five economic metrics, but different ones. They include the size of the private sector in the overall economy, taxes on individuals, taxes on consumption, taxes on businesses, and taxes on wealth.
It is useful to consider our Taxpayer Burden measure compared to current taxes of the types relied on by the Granite Index. “You can pay me now, or pay me later,” the saying goes. States can fund themselves with current taxes as well as accumulating debt, and the latter poses consequences for future taxpayers that can undermine economic growth.
But it is interesting that we came to similar conclusions, after taking different, independent routes. This analysis tends to support the Granite Institute’s conclusions.
Our State Data Lab facility can be used for analyses like this for any region you want.
For example, let’s do the same thing we did for New Hampshire and its neighbors to Illinois and its neighbors. In short, you end up with a chart like this:
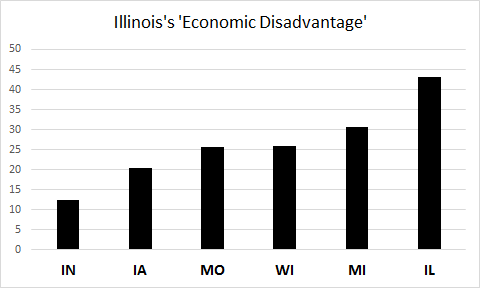
Again, bigger isn’t better on this number. Illinois ranks the lowest, compared to its neighbors.